Studying Earthquakes
People have been observing and reporting on earthquakes throughout recorded history. Although the mechanisms of quakes have not been understood until recently, it has been possible to find out quite a bit about how they work by observing their effects. Since the invention of the seismograph it has been possible to observe the different kinds of waves produced in the earth by quakes. Surprisingly, earthquake waves from a large quake can be detected around the world. This permits a study of how the waves move through the earth's interior. A comparison of readings from different places reveals that the different kinds of waves are affected in predictable ways by the density of the material through which they pass. The study of earthquake waves has shown definite layers inside the earth. See below for an explanation of how scientists have proven the existence of a solid core to the earth thousands of miles below our feet.
P-waves are the first to be felt in a quake. These are compression waves similar to sound waves that travel out directly from the focus straight through the earth. In fact, since they are similar to sound waves they can be heard. People often report hearing a sound like a train coming through the house or a sudden strong wind when there is no wind. This is the sound of the earthquake P-wave. S-waves follow with a side-to-side motion. Unlike the P-waves, S-waves follow the surface of the earth
By studying the different kinds of waves as recorded on a seismograph, it is possible to gain a picture of the quake. ( Here is a live view of a seismograph in action. ) Magnitude is determined by a study of the size of the waves. Location can be determined by comparing the direction of the quake from different stations. The directional lines from all the stations will converge on the epicenter. Interestingly, the nearest seismograph is usually not the most accurate for a large quake. Seismographs are very delicate instruments that can easily be disrupted by the very strong movements of a nearby earthquake. For instance, in the 2001 earthquake near Seattle the seismograph located in Seattle showed an initial magnitude of 4.7, compared to a more accurate 7.0 recorded in Colorado Springs (later adjusted to 6.8 after more study).
The mechanism for earthquakes, Plate Tectonics , was not discovered by studying earthquakes at all. There was a project to map the seafloor of the Atlantic Ocean, which discovered some very interesting things. They found an unexpected symmetry on both sides of the mid-Atlantic ridge. The rock on each side of the ridge got older as you moved away from the ridge. It was clear that the ocean floor was spreading from the middle. since new crust was being created at the mid-ocean ridge, it had to be absorbed back into the earth somewhere. This turned out to be in very deep trenches at the edges of continents.
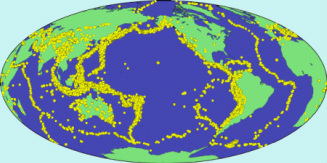
A map of earthquakes worldwide over a long period of time showed clear lines of activity that broke the earth's crust into a number of continent sized plates that were clearly in movement relative to each other. Earthquakes and volcanoes were mostly located at the borders of the plates, where they rubbed against each other. the most violent quakes were located near the trenches and were caused by one plate being forced under another. Other earthquakes were caused when two plates slid sideways relative to each other, such as the San Andreas fault in California, where the Pacific Plate is carrying a portion of the coast to the north relative to the rest of California. Yet others are the result of two plates colliding head on. India's collision with Asia has not only caused many severe quakes but has raised the Himalayas into the highest mountains on earth.
Monitoring Quakes
Seismologists use a worldwide network of seismographs to monitor earthquakes and gather as much data as they can. Over the years, they have developed instruments that can yield ever more precise information about exactly what is going on during an earthquake and to try to see the relationships between earthquakes. Scientific studies of earthquakes have a little more than a century of experience to draw on. After the 1906 San Francisco Earthquake , scientists focused their energy to learn more about such a devastating natural occurrence. Faults were mapped by mapping the location of earthquakes and observing surface features that demonstrate the ground motion. Probably the most intensely studied fault in the world is the San Andreas Fault. Located in California, conveniently close to several major universities, this fault has caused several large earthquakes, providing not only the opportunity, but a strong motivation to study it. It proved relatively easy to map the fault and to observe the traces of earthquakes from the past. The mechanism of this fault is pretty straightforward. It because clear that the western side of the fault slips a little further north with each quake. Studying when and where quakes occur led to the theory that strain slowly builds up along the fault, which is released in a quake. Over time earthquakes on different parts of the fault move the whole Pacific edge northward. Eventually Los Angeles, on the Pacific side, will be located next to San Francisco, on the North American side, but not for millions of years. Because the Loma Prieta quake occurred in an area that has been heavily studied by seismologists and was being monitored at the time, it produced a wealth of data that has aided our understanding of earthquakes. Study of this quake revealed that motion on the San Andreas fault can be more complex than previously thought. Instead of the expected horizontal slipping, in which the Pacific Plate moves north relative to the North American Plate, there was also vertical movement with the pacific Plate slipping under the North American Plate.
Scientists have learned much from Loma Prieta quake (San Jose Mercury News 10/14/09)
As they mapped the quakes along the San Andreas fault, scientists noticed that near the town of Parkfield earthquakes of about Magnitude 6.0 have occurred at a fairly regular intervals, a few decades apart. These are fairly large earthquakes, but not large enough to be catastrophic. In other words very good to study. Starting in the 1970s, the area has been monitored in detail, in the hope of having an intensive array of instruments ready when the next quake occurred. This makes earthquakes there the most studied in the world. The initial prediction, based on the gaps between previous quakes, was that the next quake would be between 1988 and 1993. It turned out that there was a longer than usual gap and no quake had occurred during that period. The project continued anyway and in 2004 the long wait was over and the next quake occurred.
Earthquake Prediction
As the Parkfield experience shows, the science of earthquake prediction has a long way to go. In the most predictable earthquake location known, it was possible to say with some certainty that a quake of a certain size, would occur. However, the prediction was off by over 10 years.. The hope, of course, is that continuing monitoring will discover precursor events that will show that a quake is coming, just as vulcanologist have learned to track the movement of magma in the volcano prior to an eruption by the swarm of small earthquakes it causes. Most of the places where earthquakes happen are known to be at risk. In fact, we can safely say that there will be another earthquake. The hard part is telling when. For instance, a prediction that there will be a repeat of the Cascadia subduction quake sometime in the next 500 years is useful in terms of making sure that we are always prepared for a disaster, and we have appropriate building codes. It is not useful in terms of evacuating the area.
The most well known predicted earthquake was in the Chinese city of Haicheng , in northeast China in 1975. Scientists noticed a number of possible precursors, including changes in land elevation and water levels, accompanied by an increase in low level seismic activity. People were also encouraged to report odd behavior of livestock and other animals, which increased before the quake. All of this led to an evacuation of this city of a million people a few days before the expected quake hit. The evacuation is estimated to have saved 150,000 lives when the 7.3 Magnitude quake hit. This successful prediction led to a great interest in the science of earthquake prediction. The citizen monitoring of water levels in wells and animal behavior led to the hope that community monitoring could provide the breadth of coverage needed to gather the clues that would help predict when and where earthquakes would hit.
Subsequent efforts to repeat the Haicheng prediction have not been successful. In another Chinese city of a million people the following year, Tangshan , a 7.6 Magnitude quake hit without the precursors that had identified the Haicheng quake. 250,000 people were killed in the quake. Although there continue to be reports of strange animal behavior leading up to quakes, there has yet to be a system for using that information in a useful way to predict quakes. Many scientists now think that it is more useful to look at changes in seismicity and deformation in the fault zone as well as other physical changes that are more quantifiable and more directly related to a possible earthquake.
One problem with trying to gather data about earthquakes is knowing where to place your instruments, since we don't know when or where the next quake will hit. In Parkfield, scientists plastered the area for years before the 2004 quake. One innovative solution was launched in 2008 to use millions of personal computers to record earthquakes as they happen. The Quake-Catcher Network uses motion sensors already built into many laptop computers. The sensors are there to protect the computer and secure the hard disk to reduce damage if it is dropped. The idea is to have the computer send a report to the Quake-Catcher Network when the sensor detects a sudden movement. If just one computer reports a shock, it was probably just dropped or shaken, but if lots of computers report a shock all together, it is probably an earthquake. The network is then in a position to gather lots of data about how and where it was felt. If there are enough participants, it could even provide an early warning system. Ten or twenty seconds warning could allow people to take cover as the earthquake waves approach.
Another approach to gathering data from the public to monitor earthquakes is the Did You Feel It? program of the USGS. The website allows you to fill out a simple form reporting how strong an earthquake felt and where you were when it occurred. The USGS puts all the responses onto a map that clearly shows where the strongest and not so strong shaking was. Here is the map generated by the 2001 Nisqually quake , near Olympia,
Interesting Links
- The Community Internet Intensity Map allows ordinary people to help out scientists studying earthquakes by reporting their experiences. You are encouraged to Report An Earthquake by filling out a questionnaire about a particular quake and view a map that shows how the quake was felt in different places.
- Seismosurfing the Web - a great resource of links to many pages relating to earthquakes.
- Pacific Northwest Earthquake Information - links to Northwest and general earthquake and volcano information
- Quake-Catcher Network - Using personal computers to capture data on earthquakes
- Earthquake Prediction page from the University of Washington.
Science Fair Projects
Check out these projects relating to earthquakes. Seismology at the Science Fair
You might also want to look at this book in our bookstore: Janice Vancleave's Earthquakes: Mind-Boggling Experiments you can turn into Science Fair Projects for more science fair ideas.
You might also want to look at this book in our bookstore: Janice Vancleave's Earthquakes: Mind-Boggling Experiments you can turn into Science Fair Projects for more science fair ideas.
